Access and monitor New Zealand’s energy in real time
em6 is New Zealand’s electricity data hub - an essential information exchange that provides flexible access to electricity market data.

12 Mar
18.85
13 Mar
18.16
14 Mar
18.21
15 Mar
17.81
16 Mar
20.76
17 Mar
21.72
18 Mar
20.40
19 Mar
18.48
20 Mar
19.18
21 Mar
19.13
22 Mar
18.88
23 Mar
19.02
24 Mar
20.93
25 Mar
21.35
12 Mar
18.22
13 Mar
18.26
14 Mar
18.28
15 Mar
18.34
16 Mar
18.52
17 Mar
18.84
18 Mar
19.13
19 Mar
19.18
20 Mar
19.25
21 Mar
19.29
22 Mar
19.30
23 Mar
19.31
24 Mar
19.37
25 Mar
19.43
12 Mar
11.61
13 Mar
11.72
14 Mar
11.80
15 Mar
11.96
16 Mar
12.11
17 Mar
12.27
18 Mar
12.40
19 Mar
12.57
20 Mar
12.73
21 Mar
12.91
22 Mar
13.06
23 Mar
13.26
24 Mar
13.43
25 Mar
13.59
12 Mar
6,545
13 Mar
18,170
14 Mar
15,325
15 Mar
16,520
16 Mar
10,100
17 Mar
9,580
18 Mar
8,355
19 Mar
16,320
20 Mar
7,255
21 Mar
15,150
22 Mar
12,245
23 Mar
12,430
24 Mar
8,605
25 Mar
5,720
12 Oct
123.33
13 Oct
123.32
14 Oct
123.28
15 Oct
123.27
16 Oct
123.28
17 Oct
123.29
18 Oct
123.26
19 Oct
123.32
20 Oct
123.30
21 Oct
123.29
22 Oct
123.30
23 Oct
123.29
24 Oct
123.30
25 Oct
123.29
Apr 25
2.60
May 25
2.85
Jun 25
2.42
Jul 25
1.14
Aug 25
1.33
Sep 25
2.74
Oct 25
0.80
Nov 25
0.85
Dec 25
0.75
Jan 26
0.66
Feb 26
2.43
Mar 26
1.70
Apr 26
1.27
May 26
1.44
Apr 25
6.39
May 25
4.81
Jun 25
7.09
Jul 25
14.21
Aug 25
12.37
Sep 25
13.73
Oct 25
6.60
Nov 25
5.85
Dec 25
5.77
Jan 26
9.38
Feb 26
30.87
Mar 26
16.64
Apr 26
16.93
May 26
15.79
12 Mar
342.91
13 Mar
317.33
14 Mar
291.10
15 Mar
228.81
16 Mar
243.37
17 Mar
299.39
18 Mar
286.54
19 Mar
281.88
20 Mar
265.33
21 Mar
270.51
22 Mar
232.23
23 Mar
163.85
24 Mar
288.79
25 Mar
347.18
12 Mar
339.59
13 Mar
311.66
14 Mar
288.37
15 Mar
221.74
16 Mar
237.59
17 Mar
303.88
18 Mar
286.52
19 Mar
281.54
20 Mar
265.67
21 Mar
269.47
22 Mar
224.59
23 Mar
162.90
24 Mar
299.45
25 Mar
356.71
12 Mar
350.15
13 Mar
327.01
14 Mar
292.50
15 Mar
242.83
16 Mar
252.86
17 Mar
309.20
18 Mar
295.56
19 Mar
283.38
20 Mar
270.38
21 Mar
271.38
22 Mar
238.74
23 Mar
189.73
24 Mar
291.89
25 Mar
341.31
12 Mar
214.4
13 Mar
211.0
14 Mar
207.1
15 Mar
190.1
16 Mar
188.7
17 Mar
213.4
18 Mar
215.5
19 Mar
213.7
20 Mar
211.4
21 Mar
207.6
22 Mar
191.8
23 Mar
187.4
24 Mar
209.5
25 Mar
210.1
13 Mar
5110
14 Mar
2496
15 Mar
0
16 Mar
0
17 Mar
4152
18 Mar
6029
19 Mar
124
20 Mar
2202
21 Mar
2736
22 Mar
0
23 Mar
0
24 Mar
4900
25 Mar
6200
26 Mar
0
12 Mar
0.00
13 Mar
0.00
14 Mar
0.00
15 Mar
0.00
16 Mar
0.00
17 Mar
0.00
18 Mar
0.00
19 Mar
0.00
20 Mar
0.00
21 Mar
0.00
22 Mar
0.00
23 Mar
0.00
24 Mar
59.00
25 Mar
0.00
12 Mar
62.78
13 Mar
62.75
14 Mar
62.66
15 Mar
62.60
16 Mar
62.59
17 Mar
62.32
18 Mar
62.17
19 Mar
61.86
20 Mar
61.51
21 Mar
61.49
22 Mar
61.49
23 Mar
61.48
24 Mar
61.38
25 Mar
61.27
12 Mar
62.77
13 Mar
62.77
14 Mar
62.75
15 Mar
62.75
16 Mar
62.75
17 Mar
62.65
18 Mar
62.61
19 Mar
62.47
20 Mar
62.29
21 Mar
62.29
22 Mar
62.29
23 Mar
62.29
24 Mar
62.23
25 Mar
62.16
13 Mar
184.34
14 Mar
181.79
15 Mar
144.99
16 Mar
146.63
17 Mar
162.63
18 Mar
153.82
19 Mar
163.16
20 Mar
155.62
21 Mar
161.02
22 Mar
155.55
23 Mar
126.63
24 Mar
139.13
25 Mar
139.08
26 Mar
147.32
13 Mar
74.56
14 Mar
74.42
15 Mar
79.28
16 Mar
78.27
17 Mar
77.02
18 Mar
77.84
19 Mar
77.26
20 Mar
78.55
21 Mar
77.31
22 Mar
78.21
23 Mar
81.24
24 Mar
79.30
25 Mar
79.22
26 Mar
78.35
We provide electricity industry data in a range of flexible packages and rates, to support your business activities when and where you need it.
Free data and visuals
Free dashboard showing real time price and generation data
- Latest market prices
- Carbon emissions indicators
- Generation summary and load data at node level
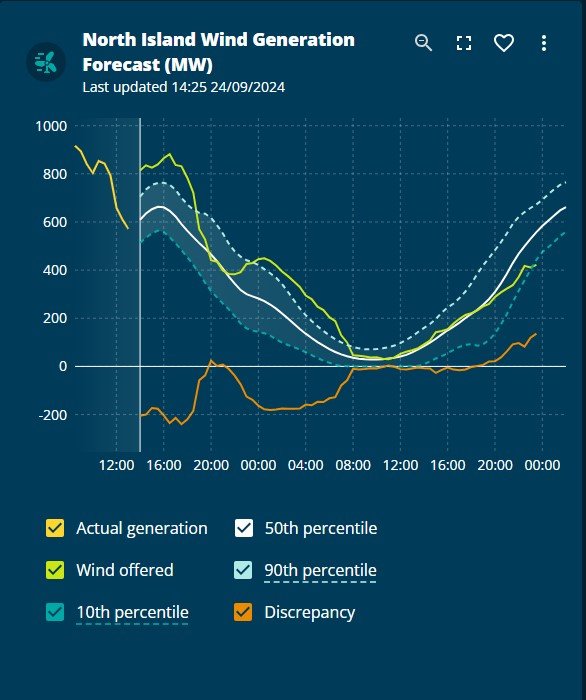
- North Island Wind Generation forecast widget
Latest market price and forecast information
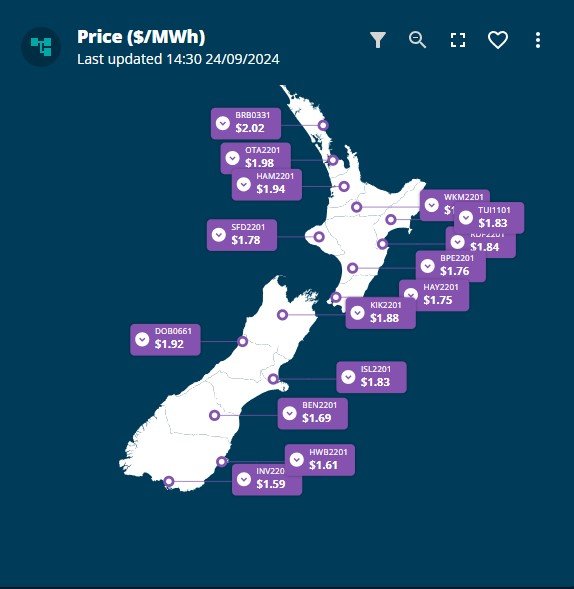
- Current wholesale electricity prices around the country
- Graphs displaying recent price fluctuations
- Price trends and forecasts for previous, current and future trading periods
- Downloadable reports for all pricing schedules at any nationwide price node
- API feeds to tap into for your own use
Wide range of load and generation data
Incredible range of load generation data across the grid, available via downloadable CSV reports, API feeds or displayed on our dashboards.
- Real-time minute by minute SCADA load data
- Load predictions graph showing movements in system operator forecasting
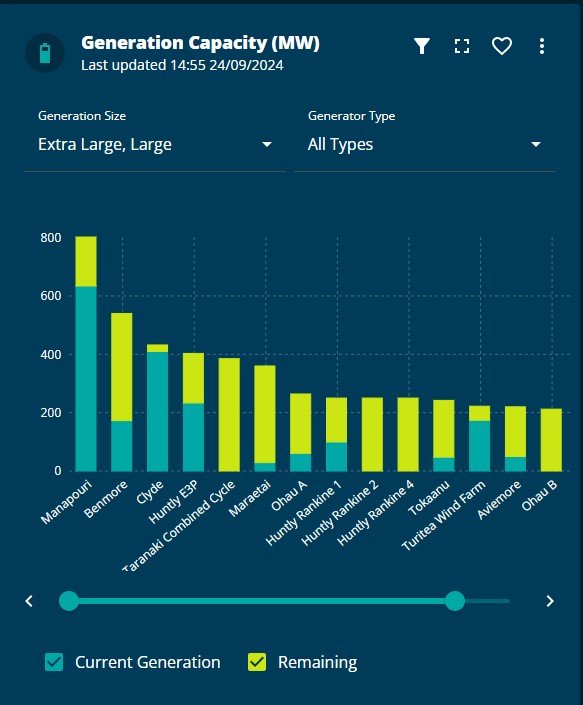
- Generation Capacity with real time snapshot of each generator's activity around the country
- Thirty-minute HVDC flow data
- Residuals data for New Zealand and by island, for different schedules
- RCPD and yearly peaks information
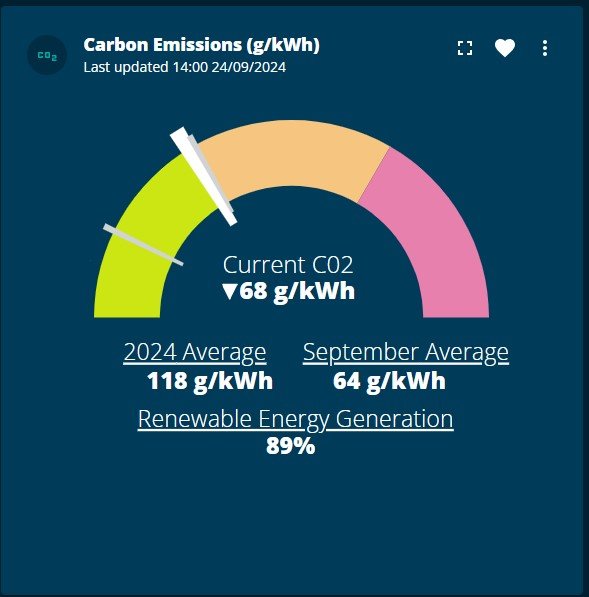
Half-hourly carbon emissions data
We produce our own half-hourly emissions data feed based on generation data and carbon intensity factors for each power generator supplying the national grid.
- Underlying data and carbon intensity methodology verified by Toitū Envirocare for use by companies reporting their emissions
- Free current carbon intensity indicator, renewable energy generation percentage, and API feed
- Historic carbon intensity emissions data API feed